Skip to Main Content
_
Sensor Network
Maps & Radar
Severe Weather
News & Blogs
Mobile Apps
More
Search
close
gps_fixed
gps_fixed
Find Nearest Station
Manage Favorite Cities
Log In
Go Ad Free
account_box
Log in
Go Ad Free
settings
Settings
Sensor Network
Maps & Radar
Severe Weather
News & Blogs
Mobile Apps
Historical Weather
star
Current Weather for
Popular
Cities
San Francisco, CA
51
°
F
Mostly Cloudy
Manhattan, NY
47
°
F
Cloudy
Schiller Park, IL (60176)
warning
42
°
F
Clear
Boston, MA
46
°
F
Cloudy
Houston, TX
74
°
F
Cloudy
St James's, England, United Kingdom
55
°
F
Rain Shower
Search
close
gps_fixed
gps_fixed
Find Nearest Station
Manage Favorite Cities
settings
--
Feels like
--
--
--
/
--
--
--
--
--
--
--
--
--
--
12AM
6AM
NOON
6PM
12AM
Apr 19
+0000
Apr 20
Full Forecast
See When And Where Rain Will Be The Heaviest
A stalled frontal boundary brings heavy rain and a flood threat to the South through the weekend. Here’s what you need to know.
See When And Where Rain Will Be The Heaviest
Massive Octopus Leads Diver To Underwater Mystery
An Australian diver was “shocked” when a friendly octopus led her by the hand to show her an underwater mystery.
Massive Octopus Leads Diver To Underwater Mystery
Growing Fear Of Bird Flu Spreading To Humans
The World Health Organization says the potential spread of bird flu to humans is of “enormous concern,” citing the disease’s recent jump to dairy cows.
Growing Fear Of Bird Flu Spreading To Humans
2024 Hurricane Outlook Predicts One Of The Busiest Seasons
This is likely to be among the busiest hurricane seasons on record according to the first Weather Company outlook for the season.
2024 Hurricane Outlook Predicts One Of The Busiest Seasons
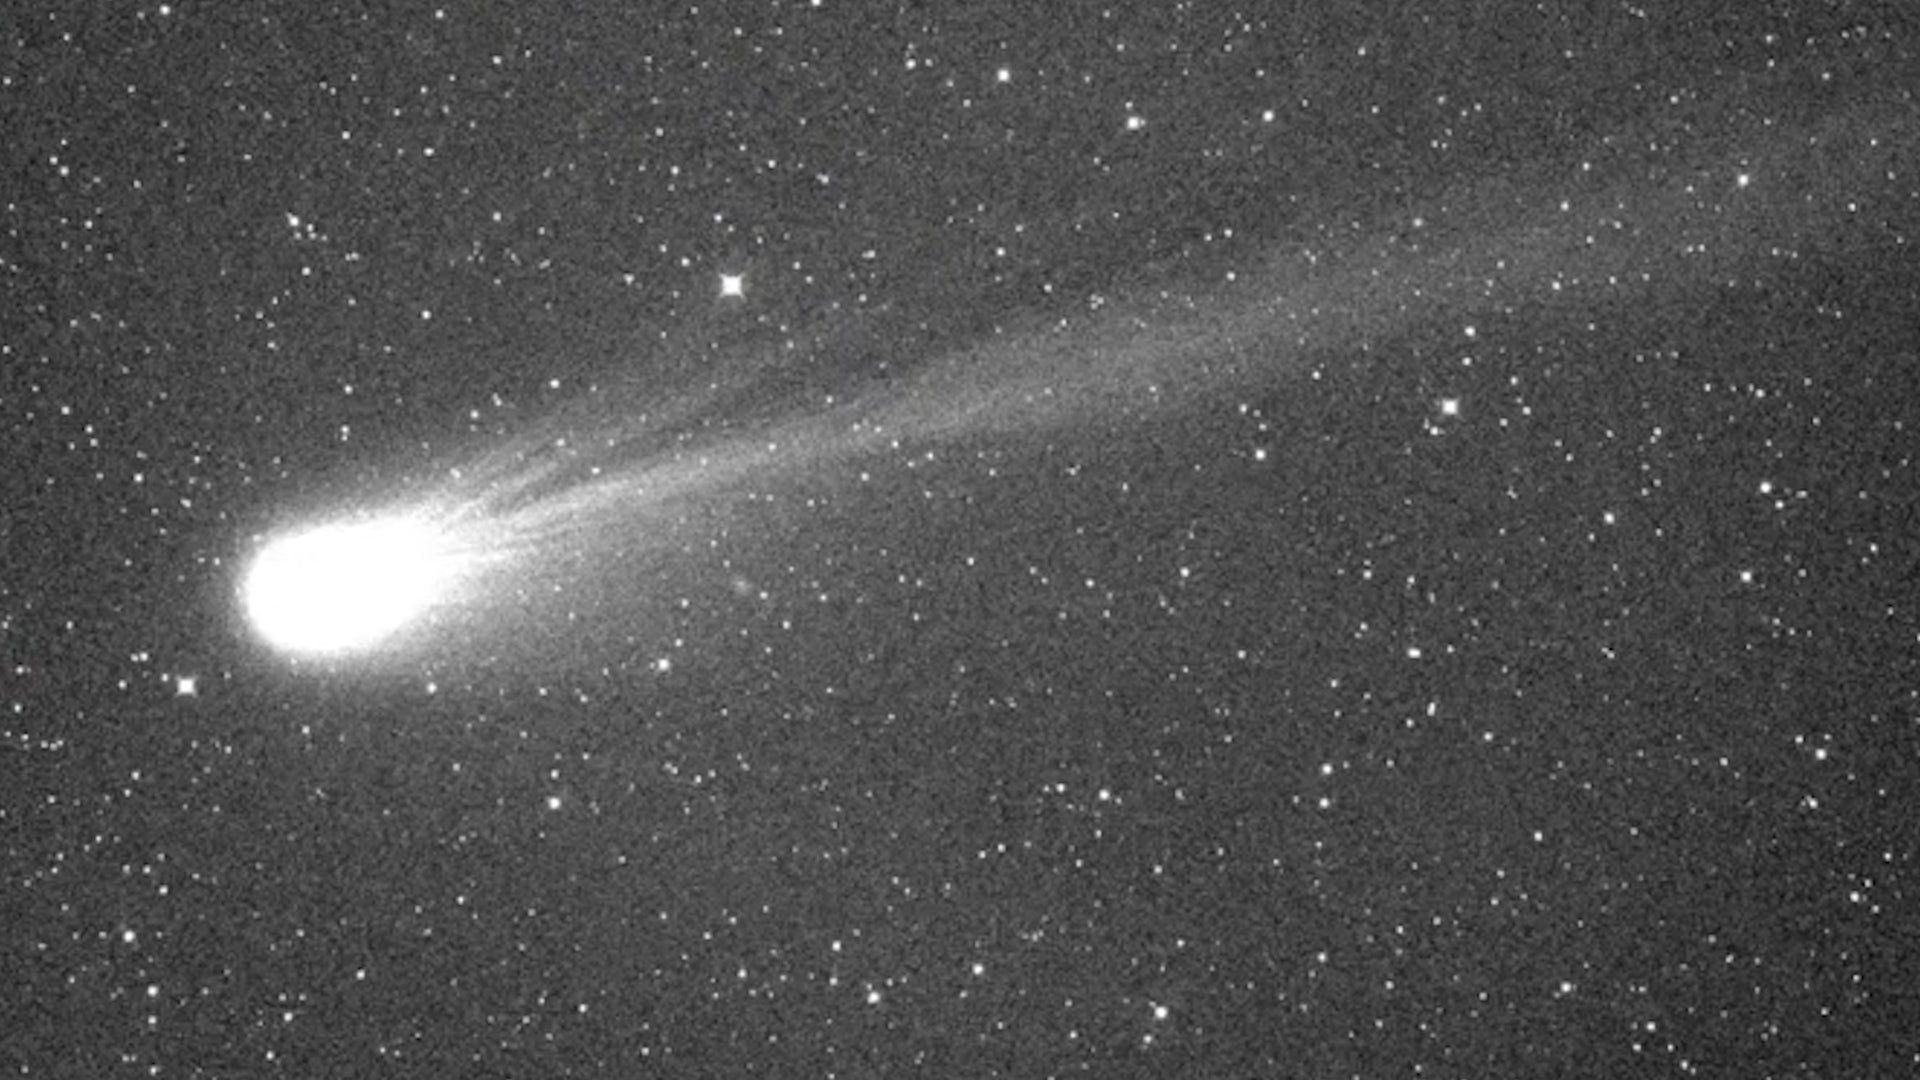
How To See The Massive ‘Mother Of Dragons’ Comet
The bright green comet 12P/Pons-Brooks, also known as the “devil” and “mother of dragons,” will reach peak visibility soon. Here’s how to spot it.
How To See The Massive ‘Mother Of Dragons’ Comet
Please enable JavaScript to continue using this application.