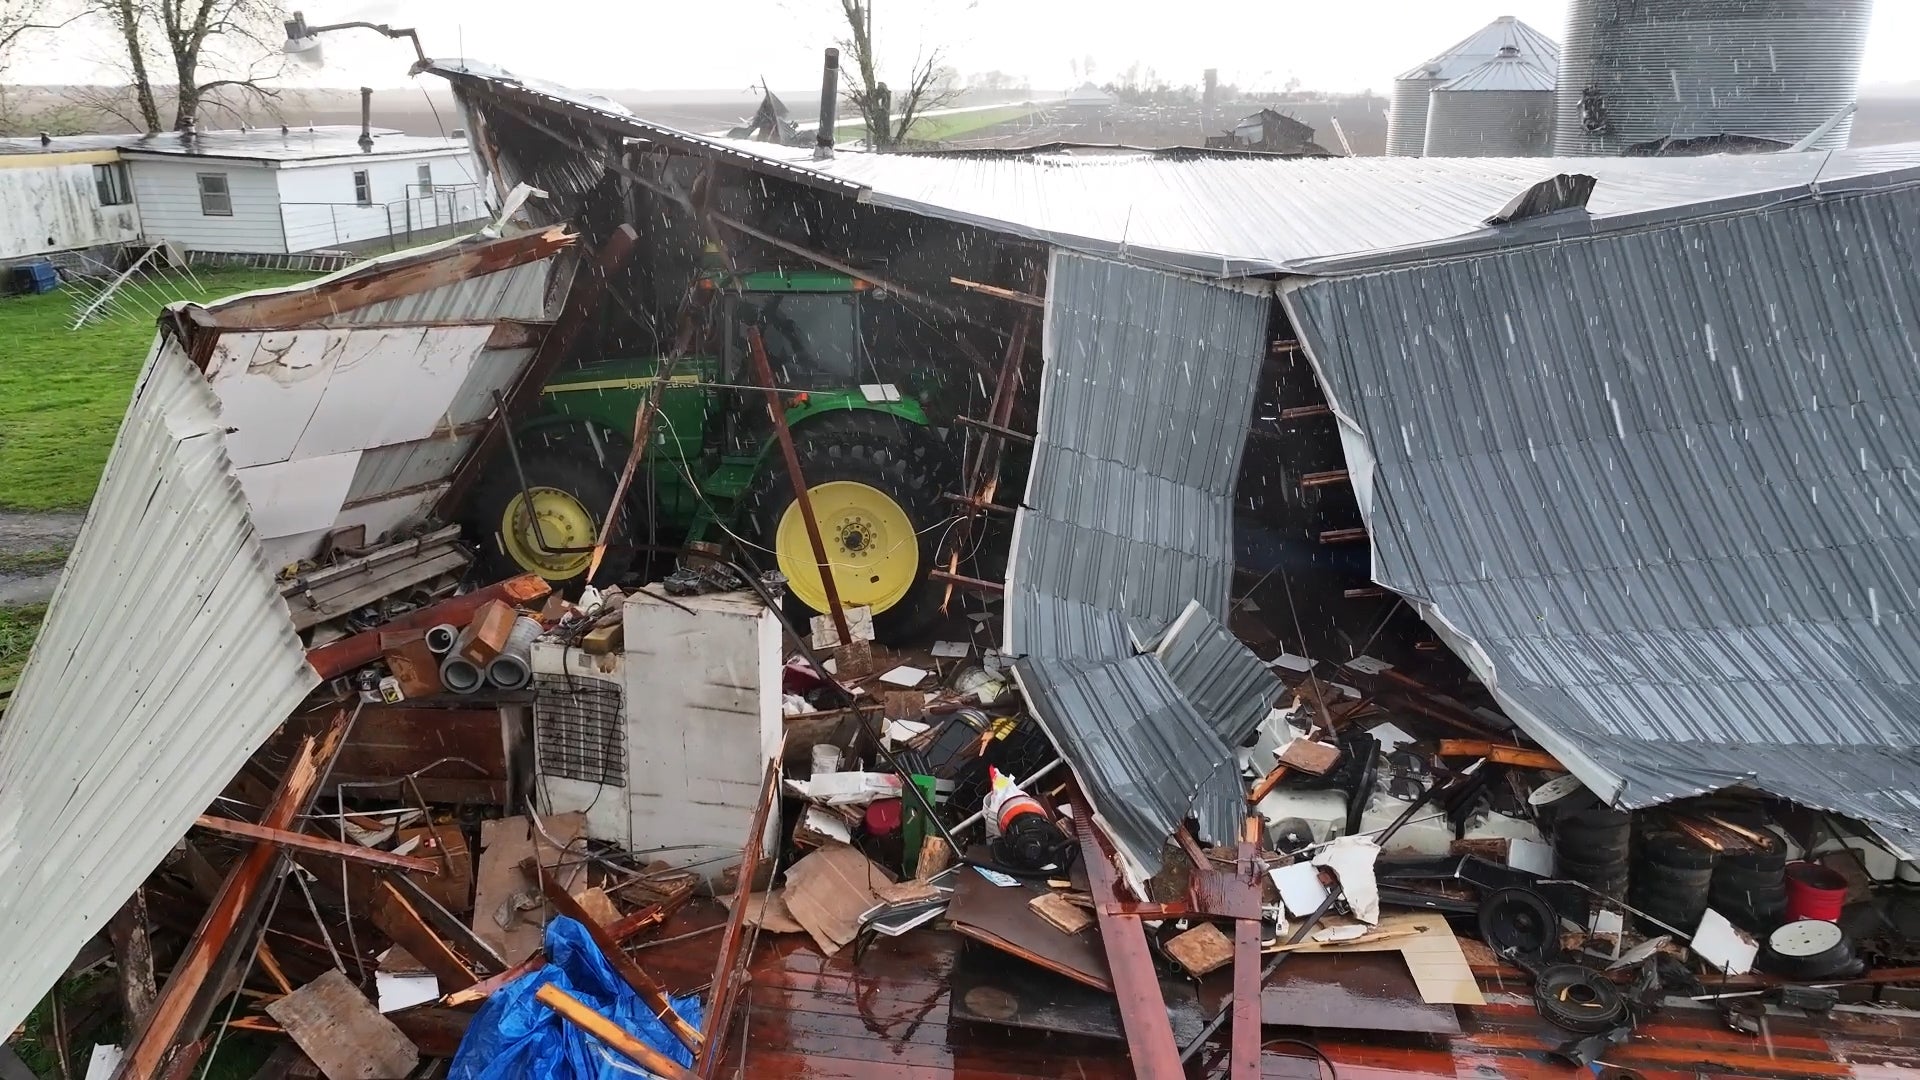
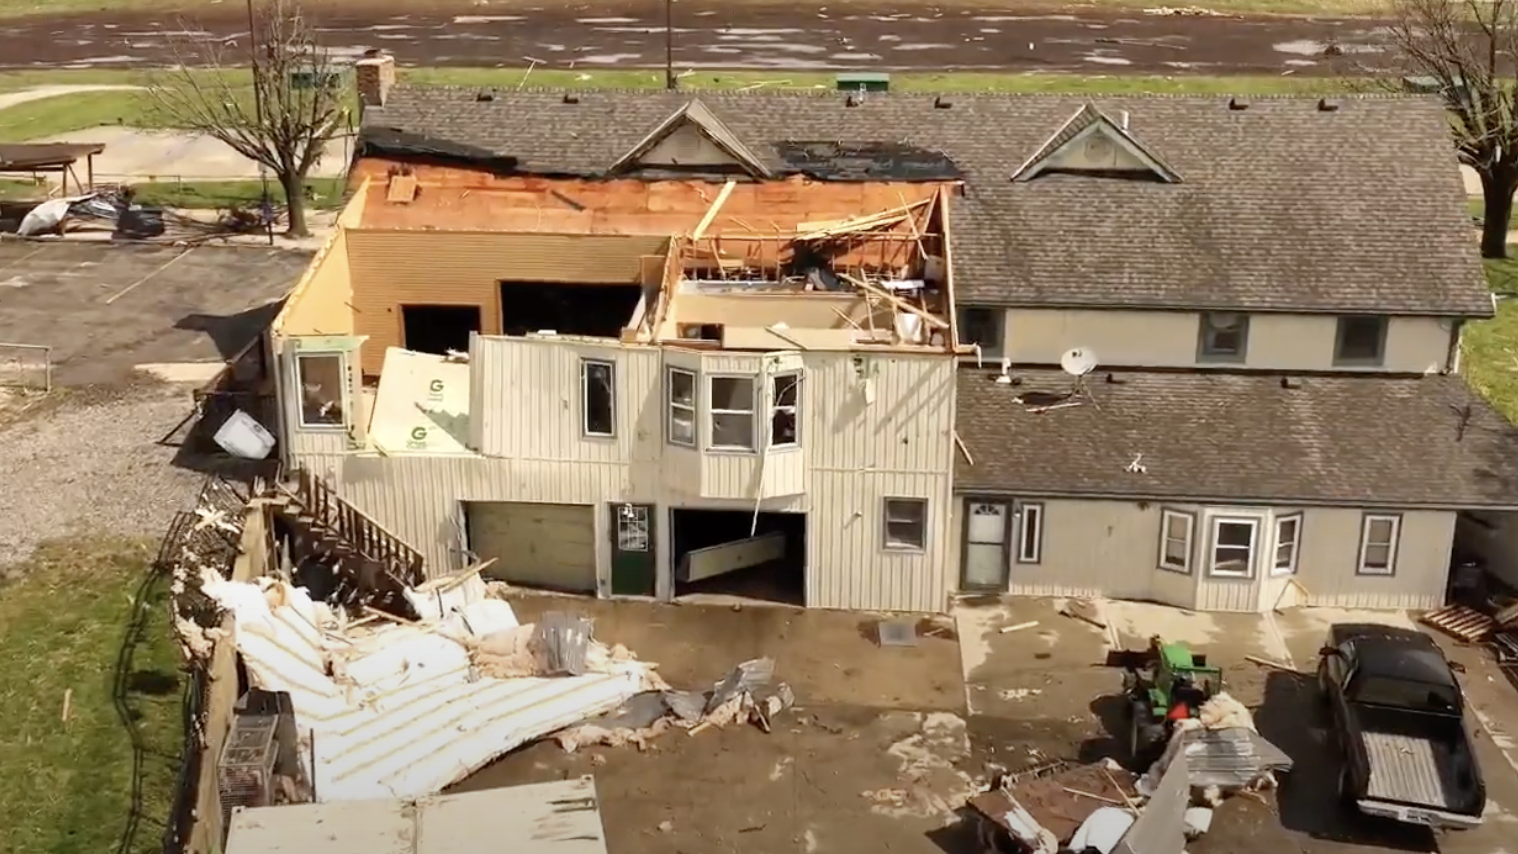
Global warming and the frequency of intense Atlantic hurricanes: model results
Could global warming increase wind shear over the Atlantic, potentially leading to a decrease in the frequency of Atlantic hurricanes? There is a growing consensus among hurricane scientists that this is indeed quite possible. Two recent studies, by Zhao et al. (2009), "Simulations of Global Hurricane Climatology, Interannual Variability, and Response to Global Warming Using a 50-km Resolution GCM", and by Knutson et al. (2008), "Simulated reduction in Atlantic hurricane frequency under twenty-first-century warming conditions", found that global warming might increase wind shear over the Atlantic by the end of the century, resulting in a decrease in the number of Atlantic hurricanes. For example, the second study took 18 relatively coarse (>60 km grid size) models used to formulate the 2007 IPCC climate report, and "downscaled" them using a higher-resolution (18 km grid size) model called ZETAC that was able to successfully simulate the frequencies of hurricanes over the past 50 years. When the 18 km ZETAC model was driven using the climate conditions we expect in 2100, as output by the 18 IPCC models, the authors found that a reduction of Atlantic tropical storms by 27% and hurricanes by 18% by the end of the century resulted. An important reason that their model predicted a decrease in the frequency of Atlantic hurricanes was due to a predicted increase in wind shear. As I explain in my wind shear tutorial, a large change of wind speed with height over a hurricane creates a shearing force that tends to tear the storm apart. The amount of wind shear is critical in determining whether a hurricane can form or survive.

Figure 1. Top: predicted change by 2100 in wind shear (in meters per second per degree C of warming--multiply by two to get mph) as predicted by summing the predictions of 18 climate models. Bottom: The number of models that predict the effect shown in the top image. The dots show the locations where tropical storms formed between 1981-2005. The box indicates a region of frequent hurricane formation where wind shear is not predicted to change much. Image credit: Geophysical Research Letters, "Increased Tropical Atlantic Wind Shear in Model Projections of Global Warming", by Vecchi and Soden, 2007.
Since the Knutson et al. study using the 18 km resolution ZETAC model was not detailed enough to look at what might happen to major Category 3 and stronger hurricanes, a new study using a higher resolution model was needed. This was done by a team of modelers led by Dr. Morris Bender of NOAA's GFDL laboratory, who published their results in Science in February. The authors used the GFDL hurricane model--the model that has been our best-performing operation hurricane track forecasting model over the past five years--to perform their study. The GFDL hurricane model runs at a resolution of 9 km, which is detailed enough to make accurate simulations of major hurricanes. The researchers did a double downscaling study, where they first took the forecast atmospheric and oceanic conditions at generated by the coarse (>60 km grid) IPCC models, used these data to initialize the finer resolution 18 km ZETAC model, then used the output from the ZETAC model to initialize the high-resolution GFDL hurricane model. The final results of this "double downscaling" study suggest that although the total number of hurricanes is expected to decrease by the end of the century, we should expect an increase of 81% in the number of Category 4 and 5 storms in the Atlantic. This trend should not be clearly detectable until about 60 years from now, given a scenario in which CO2 doubles by 2100. The authors say that their model predicts that there should already have been a 20% increase in the number of Category 4 and 5 storms since the 1940s, given the approximate 0.5°C warming of the tropical Atlantic during that period. This trend is too small to be detectable, given the high natural variability and the difficulty we've had accurately measuring the exact strength of intense hurricanes before the 1980s.The region of the Atlantic expected to see the greatest increase in Category 4 and 5 storms by the year 2100 is over the Bahama Islands (Figure 2), since wind shear is not expected to increase in this region, and sea surface temperatures and atmospheric instability are expected to increase there.
The net effect of a decrease in total number of hurricanes but an increase in the strongest hurricanes should cause an increase in U.S. hurricane damages of about 30% by the end of the century, the authors compute, assuming that hurricane damages behave as they did during the past century. Over the past century, Category 4 and 5 hurricanes made up only 6% of all U.S. landfalls, but accounted for 48% of all U.S. damage (if normalized to account for increases in U.S. population and wealth, Pielke et al., 2008.)

Figure 2. Expected change in Atlantic Category 4 and 5 hurricane per decade expected by the year 2100, accord to the Science paper by Bender et al. (2010).
Commentary
These results seem reasonable, since the models in question have been successfully been able to simulate the behavior of hurricanes over the past 50 years. However, the uncertainties are high and lot more research needs to be done before we can be confident of the results. Not all of the IPCC models predict an increase in wind shear over the tropical Atlantic by 2100, so the increase in Category 4 and 5 hurricanes could be much greater. Also, the GFDL model was observed to under-predict the strength of intense hurricanes in the current climate, so it may not be creating enough Category 4 and 5 hurricanes in the future climate of 2100. On the other hand, IPCC models such as the UKMO-HadCM3 predict a very large increase in wind shear, leading to a drastic reduction in all hurricanes in the Atlantic by 2100, including Category 4 and 5 storms. So Category 4 and 5 hurricane frequency could easily be much greater or much less than the 81% increase by 2100 found by Bender et al.
The estimates of a 30% increase in hurricane damages by 2100 may be considerably too low, since this estimate assumes that sea level rise will continue at the same pace as was observed in the 20th century. Sea level rise has accelerated since the 1990s, and it is likely that this century we will see much more than than the 7 inches of global sea level rise that was observed last century. Higher sea level rise rates will sharply increase the damages due to storm surge, which account for a large amount of the damage from intense Category 4 and 5 hurricanes.
Keep in mind that while a 30% in hurricane damage by the end of the century is significant, this will not be the main reason hurricane damages will increase this century. Hurricane damages are currently doubling every ten years, according to Pielke et al., 2008. This is primarily due to the increasing population along the coast and increased wealth of the population. The authors theorize that the Great Miami Hurricane of 1926, a Category 4 monster that made a direct hit on Miami Beach, would have caused about $150 billion in damage had it hit in 2005. By 2015, the authors expect the same hurricane would do $300 billion in damage. This number would increase to $600 billion by 2025 (though I think it is likely that the recent recession may delay this damage total a few years into the future.) It is essential that we limit coastal development in vulnerable coastal areas, particularly along barrier islands, to reduce some of the astronomical price tags hurricanes are going to be causing. Adoption and enforcement of strict building standards is also a must.
The authors of the GFDL hurricane model study have put together a nice web page with links to the paper and some detailed non-technical explanations of the paper.
References
Bender et al., 2010, "Modeled Impact of Anthropogenic Warming on the Frequency of Intense Atlantic Hurricanes", Science, 22 January 2010: Vol. 327. no. 5964, pp. 454 - 458 DOI: 10.1126/science.1180568.
Vecchi, G.A., B.J. Soden, A.T. Wittenberg, I.M. Held, A. Leetmaa, and M.J. Harrison, 2006, "Weakening of tropical Pacific atmospheric circulation due to anthropogenic forcing", Nature, 441(7089), 73-76.
Vecchi, G.A., and B.J. Soden, 2007, "Increased Tropical Atlantic Wind Shear in Model Projections of Global Warming", Geophysical Research Letters, 34, L08702, doi:10.1029/2006GL028905, 2007.
Jeff Masters
Reader Comments
Page: 1 | 2 | 3 | 4 | 5 | 6 | 7 | 8 | 9 | 10 | 11 | 12 | 13 | 14 | 15 | 16 | 17 | 18 | 19 | 20 | 21 | 22 | 23 | 24 | 25 | 26 | 27 | 28 | 29 | 30 | 31 | 32 | 33 | 34 | 35 | 36 | 37 | 38 | 39 | 40 | 41 | 42 | 43 | 44 | 45 | 46 — Blog Index
Nicely done :) Those are some good points you're making to the public so that they are aware of the dangers of every season.
Did a good job with just a minute.
I think the last day i watched TWC for more than about a minute was the last time Dave Shwartz was on. TWC died with him being fired/quitting/whatever.
Yea, its tough trying to condense so much info into a minute and at the same time keep it easy to understand for the viewer. I bet just about anyone on this blog could talk about this upcoming season for several minutes or more.
You did a good job for the time you had. It is hard to explain everything in a short time....that's why TV segments aren't the greatest outlet, but they do reach the most people.
Its very frustrating at times. We do air a hurricane show in June, but mainly about what to do and where to go. Not so much about predictions. Presslord will tell ya. He's from these parts and went through Hugo.
I don't think this blog can handle a Hurricane like that. I think the blog would literary explode.
That has also disturbed me some. Massive near-mega quakes happening every other week, snow in Florida followed in January and now there is a massive heatwave in the Northeast, for April that is. The first actively named tropical cyclone (Anita) formed in March since Cyclone Catrina. El Nino forcasted to turn into La Nina to boot..
Chucktown, you did a great job explaining El Nino and how it impacts the ATL Hurricane Season.
April 7:
We recently added Dish Network, I watched TWC for the first time in a few years. It is NOT The Weather Channel anymore :o(
April 1:
April 7:
Thanks Press, thats why I've been working so much, my little side kick you speak of is on vacay - at least its been nice. We could use some rain, maybe tomorrow night. Weekend looks fantastic !!
I think its' great TV mets are involved on here. We could use more around here
Back in the "good ol' days" TWC was all about weather, people who "ate, drank and slept weather". Real live weather forecasts!! NOW, TWC is a commercialized weather show, more concerned about "their sponsors"!!
By the way, it's my opinion the Severe Weather threat for mid TN is diminishing. Looks like a heavy rain event, maybe 40 MPH winds and small hail.
Is that the last gas of El Nino?
Saw that t-dude. Quite a line there.
Positive Phase:
Negative Phase
The CFS forecast for a positive phase of the IOD to develop in August and September:
Yup. The cooler subsurface temperatures are strengthening while the warm subsurface temps are weakening. If the CFS forecast holds true we should see cool subsurface anomalies reach the surface by May:
A lot of talk has been made about the very warm water that has been prevalent in the tropical Atlantic since the beginning of the year. I have written a few posts about it and it seems that this has the potential to play quite an important role in this year's hurricane season. However, the Gulf of Mexico still remains well below normal, sea surface temp-wise, in most of that region. That is about to change.
Take a look at the graphic below. It is today's SST anomaly map from NOAA/NESDIS. As you can clearly see, the Gulf is painted in mostly blues and even some purples- indicating significant departures from normal on the negative side. But notice the Loop Current nosing its way up through the central Gulf. Also notice the positive anomalies in the Caribbean, getting warmer the farther east you go. Those two features, coupled with the strong and increasing sun angle, will mean that Gulf SSTs will be back to normal, and possibly above in some places, very soon. The reason the water is so cool, relative to average, is because of the relentless onslaught of storms this winter that brought cold air and strong winds to the open Gulf. This is reversing now and with the abundant warmth in the East and South, water temps are rebounding quickly.
This is all part of the overall larger picture of SSTs that are running as much as two degrees C above normal across the entire tropical Atlantic- roughly south of 20 degrees latitude. As I have mentioned in earlier posts about this, the weaker sub-tropical high, or Azores High, has lead to lighter trade winds blowing across the Atlantic, thus allowing SSTs to warm to above normal levels. In fact, this is exactly what an El Nino is in the Pacific. Perhaps there needs to be a name for the Atlantic version.
Sea surface temps are only part of the overall equation when dealing with tropical cyclones. While there is mounting evidence to suggest that a very busy hurricane season is coming, it is no guarantee and no one knows where any hurricanes that do form will ultimately end up. None the less, people who are looking forward to fishing, boating and enjoying the usually warm Gulf, it's coming.
by Mark Sudduth
That's a funny comment....the two processes are not the same at all...the light trades over the eastern Atlantic are not caused by the same things that cause light trades over the Pacific.
April 5, 2005
April 5, 2010
The only major difference between these two maps is the water temperature anomalies in the Northwest Pacific Ocean.
The difference lies in the warmer temperature anomalies in the MDR now than 2005.
Yea.. We are a tad warmer in the MDR now compared to 2005 but not by much. The MDR on average is only .25C warmer now than 2005.
img src="http://www.spc.noaa.gov/products/md/mcd0288.gif" alt=""
MESOSCALE DISCUSSION 0288
NWS STORM PREDICTION CENTER NORMAN OK
1016 PM CDT WED APR 07 2010
AREAS AFFECTED...CENTRAL KY/SERN INDIANA/SWRN OH/MIDDLE TN
CONCERNING...SEVERE THUNDERSTORM WATCH 63...64...
VALID 080316Z - 080515Z
THE SEVERE WEATHER THREAT FOR SEVERE THUNDERSTORM WATCH
63...64...CONTINUES.
COMPLEX LINE OF THUNDERSTORMS -- WITH EMBEDDED BOWS AND AN
ASSOCIATED/LOCAL THREAT FOR DAMAGING WINDS...CONTINUES ACROSS THE TN
AND MID OH VALLEY REGIONS.
DESPITE INCREASINGLY UNFAVORABLE THERMODYNAMIC ENVIRONMENT...A LINE
OF THUNDERSTORMS -- AHEAD OF AN ADVANCING FRONT -- HAS PERSISTED EWD
ACROSS THE TN/MID OH VALLEY REGION THIS EVENING. SEVERAL STRONGER
BOWING LINE SEGMENTS PERSIST ATTM ACROSS WW 63 AND 64...THOUGH SOME
GENERAL WEAKENING HAS BEEN OBSERVED OVER THE PAST HOUR.
STILL...WITH THE CONVECTION APPARENTLY BEING SUSTAINED MORE
DYNAMICALLY THAN THERMODYNAMICALLY...IT APPEARS POSSIBLE THAT THE
POTENTIAL FOR DAMAGING WINDS MAY PERSIST FOR THE NEXT COUPLE OF
HOURS -- LONGER THAN WOULD OTHERWISE BE EXPECTED.
..GOSS.. 04/08/2010
ATTN...WFO...ILN...LMK...OHX...IND...HUN...PAH...MEG...
LAT...LON 34258951 36708796 37408665 38728605 39118382 36658556
34768768 34258951
Where are you getting the MDR average?
The Caribbean, however, is on fire.
Here's a link Drak.
Link
You won't be able to tell the difference in about a month.
Really, that quickly?
holy flipping sugar
April7
Well I used to go fishing all the time off the Louisiana Coastline pre-Katrina and every year the Gulf water temperature would dramatically warm up in the last week of April into the first week of May. So in my opinion it is pretty safe to assume that in the next month that the Gulf of Mexico will warm quite a bit. Plus, both the GFS and ECMWF show continued ridging over the central CONUS with the axis being just east of the Mississippi River Valley which will only enhance warming.
Much appreciated.
IRLoop
Anytime!
Down here in Florida it's flounder and grouper mostly. And of course shrimp.
Viewing: 1401 - 1451
Page: 1 | 2 | 3 | 4 | 5 | 6 | 7 | 8 | 9 | 10 | 11 | 12 | 13 | 14 | 15 | 16 | 17 | 18 | 19 | 20 | 21 | 22 | 23 | 24 | 25 | 26 | 27 | 28 | 29 | 30 | 31 | 32 | 33 | 34 | 35 | 36 | 37 | 38 | 39 | 40 | 41 | 42 | 43 | 44 | 45 | 46 — Blog Index