Skip to Main Content
_
Sensor Network
Maps & Radar
Severe Weather
News & Blogs
Mobile Apps
More
Search
close
gps_fixed
gps_fixed
Find Nearest Station
Manage Favorite Cities
Log In
Go Ad Free
account_box
Log in
Go Ad Free
settings
Settings
Sensor Network
Maps & Radar
Severe Weather
News & Blogs
Mobile Apps
Historical Weather
star
Current Weather for
Popular
Cities
San Francisco, CA
56
°
F
Fair
Manhattan, NY
57
°
F
Clear
Schiller Park, IL (60176)
warning
68
°
F
Cloudy
Boston, MA
53
°
F
Clear
Houston, TX
76
°
F
Cloudy
St James's, England, United Kingdom
42
°
F
Mostly Cloudy
Search
close
gps_fixed
gps_fixed
Find Nearest Station
Manage Favorite Cities
settings
--
Feels like
--
--
--
/
--
--
--
--
--
--
--
--
--
--
12AM
6AM
NOON
6PM
12AM
Apr 17
+0000
Apr 18
Full Forecast
Dangerous Severe Weather Includes Large Hail, Thunderstorms
We've had a lot of severe weather lately. Here's what we are most concerned about in the coming days.
Dangerous Severe Weather Includes Large Hail, Thunderstorms
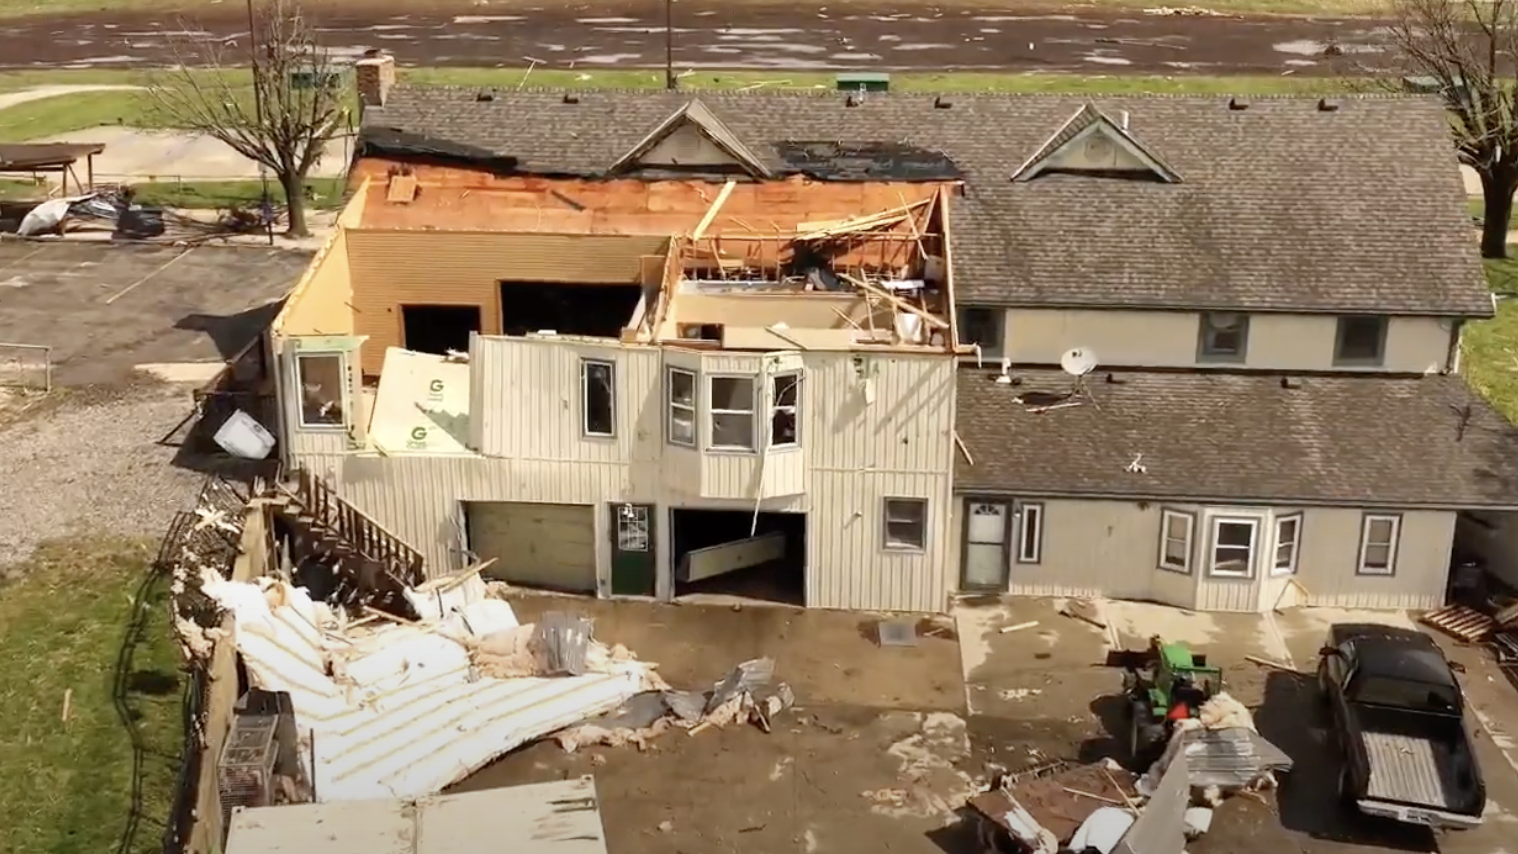
Roofs Ripped Off, At Least 2 Injured
Severe weather ripped across parts of the Midwest Tuesday.
Roofs Ripped Off, At Least 2 Injured
Landslide Horror On Island Kills 20
A landslide in rainy Indonesia crushed four homes, one of which is said to have been hosting a family gathering. The final two missing people have now been found dead, bringing the death toll to 20.
Landslide Horror On Island Kills 20
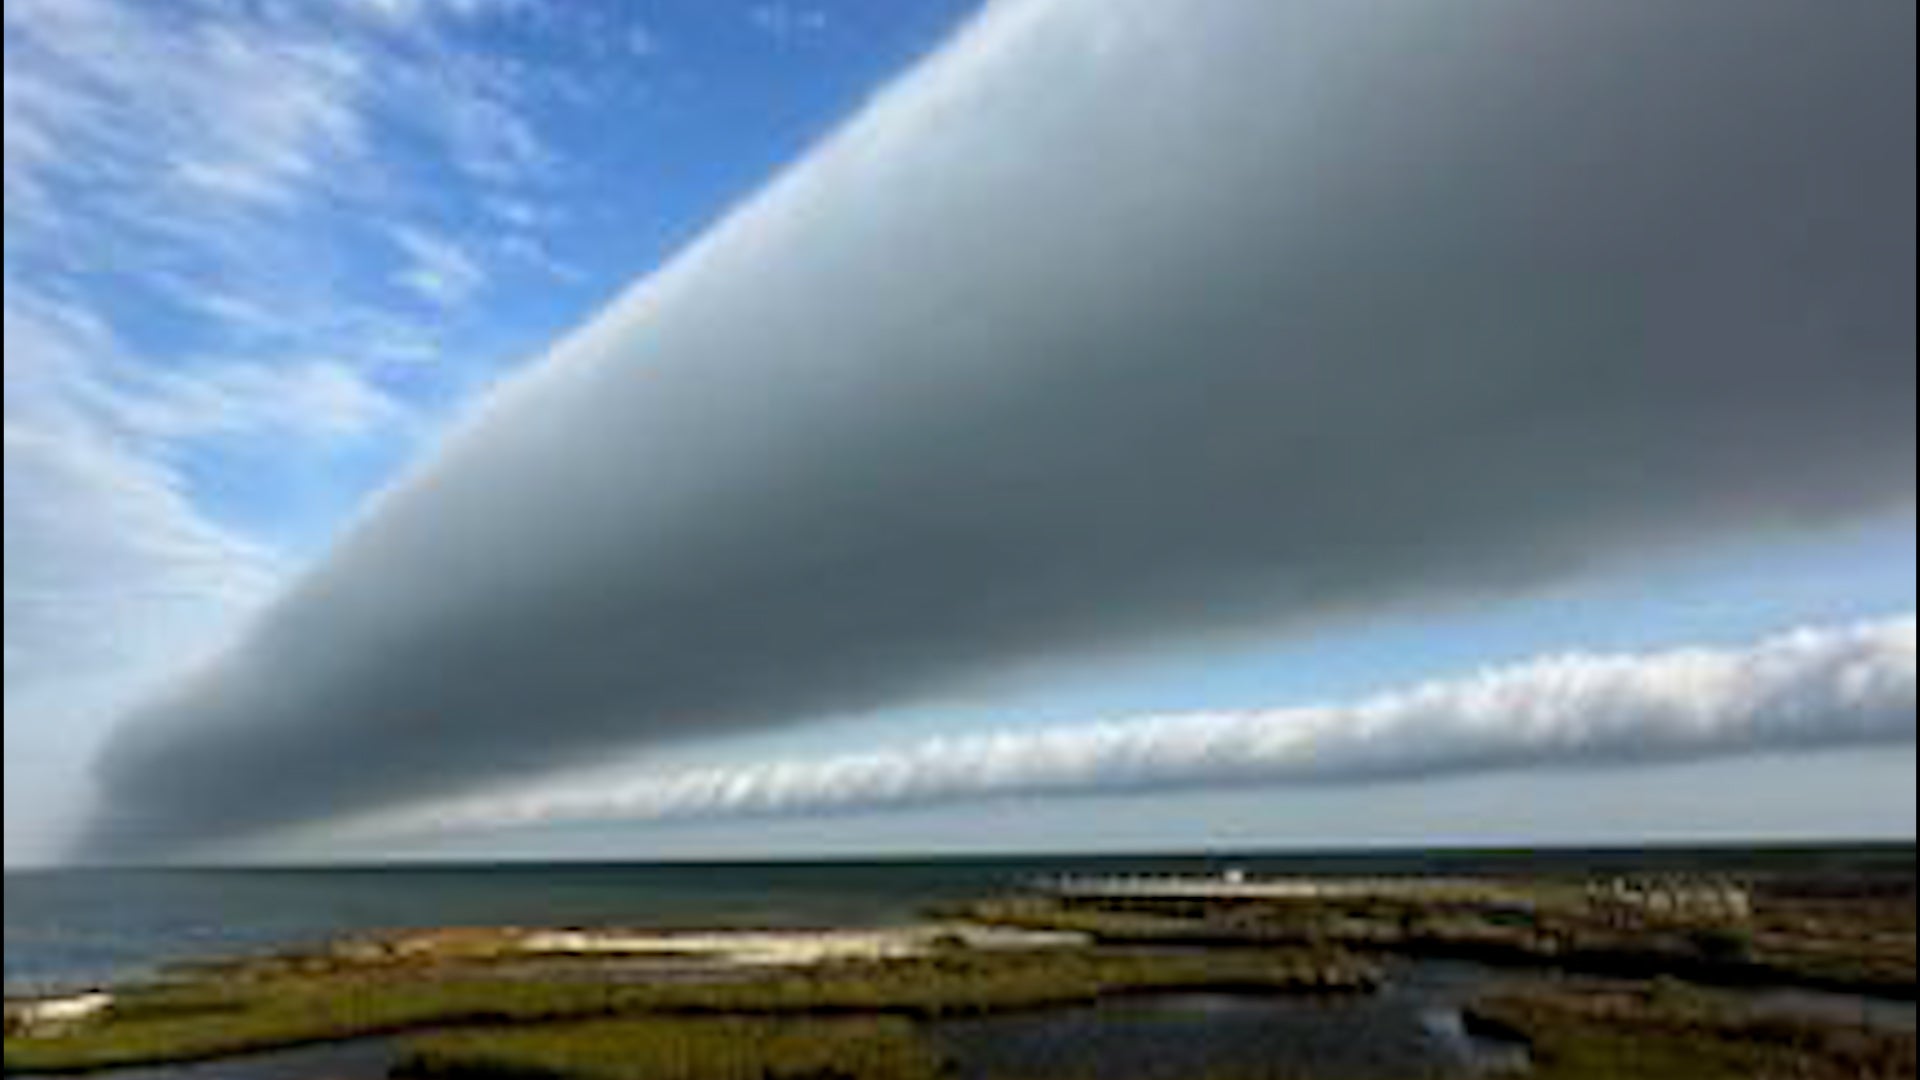
Watch Rare Wave Clouds Soar In North Carolina Skies
Wave clouds, also known as an undular bore, soared across the sky along North Carolina’s Outer Banks.
Watch Rare Wave Clouds Soar In North Carolina Skies
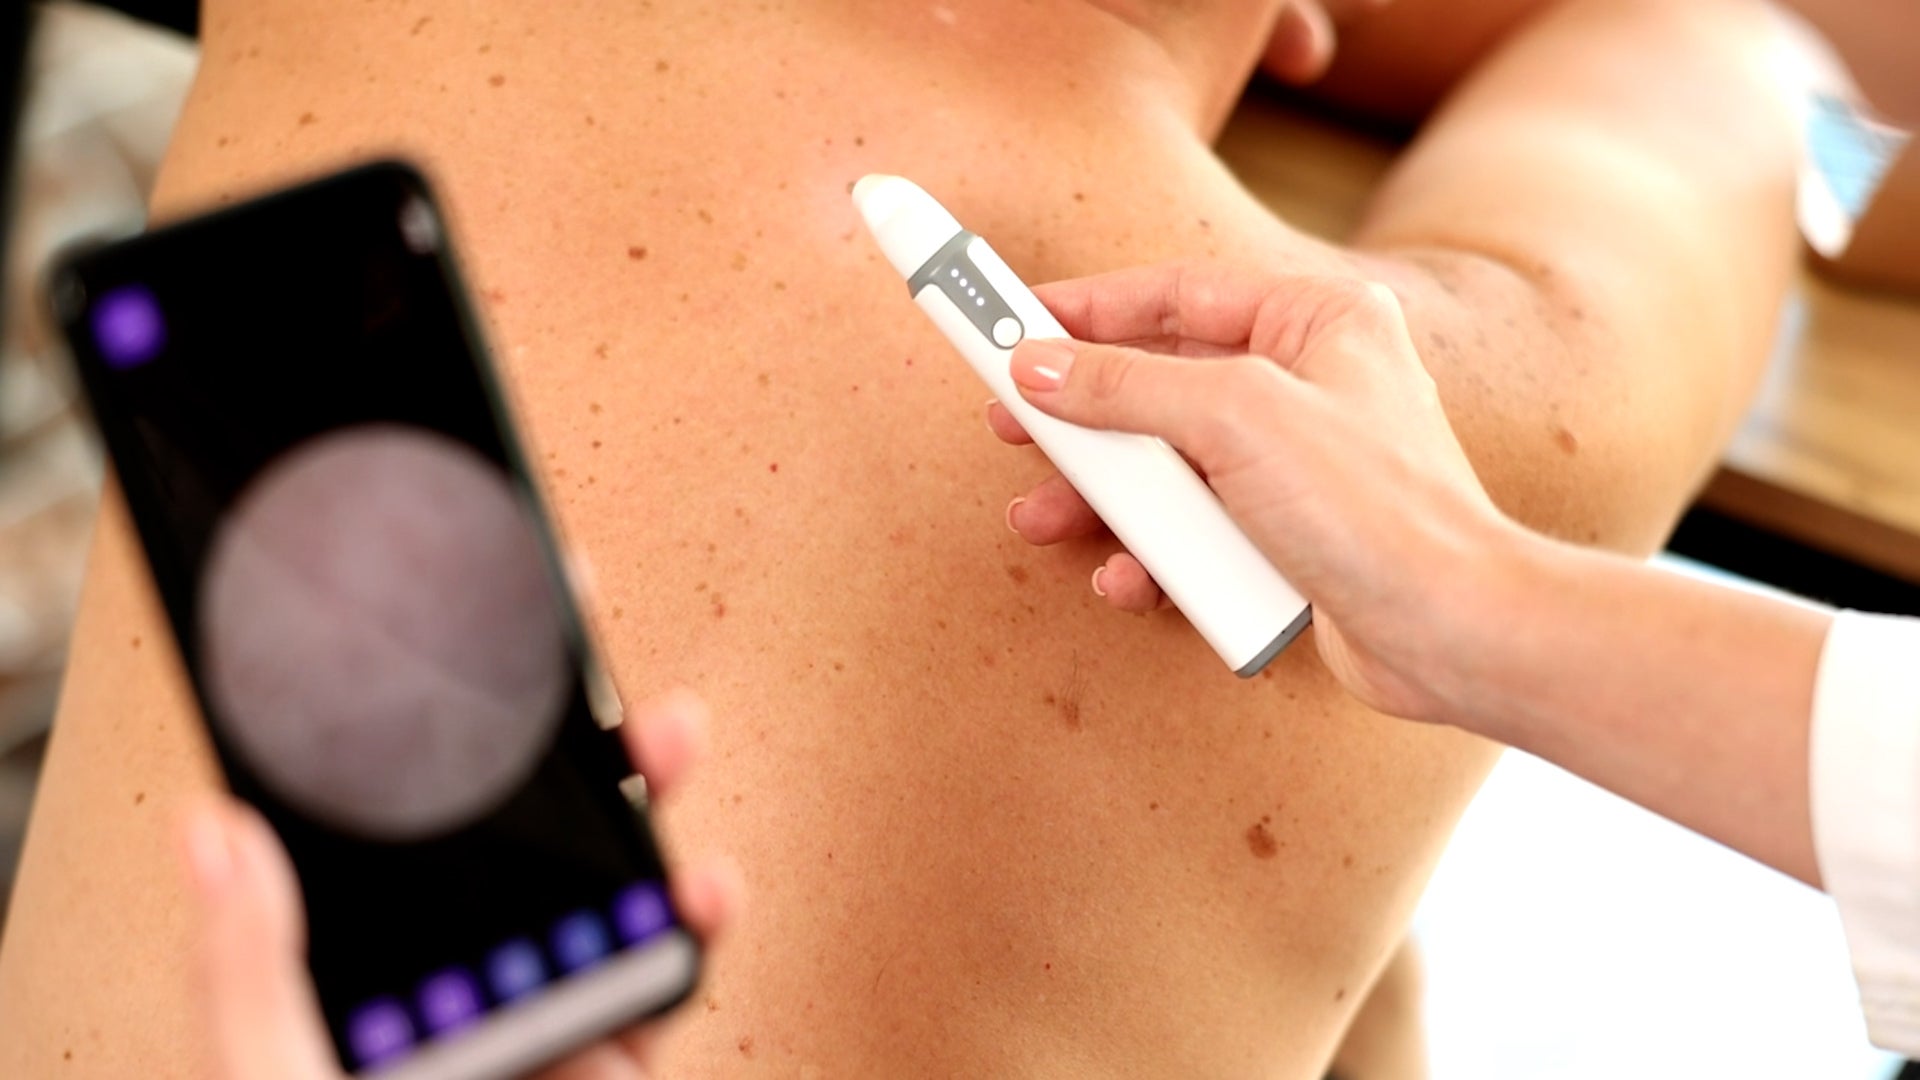
Reduce The Risk Of Melanoma: Deadliest Form Of Skin Cancer
Get ready for summer while staying skin-safe: learn how to spot, prevent, and treat melanoma, the deadliest form of skin cancer.
Reduce The Risk Of Melanoma: Deadliest Form Of Skin Cancer
Please enable JavaScript to continue using this application.