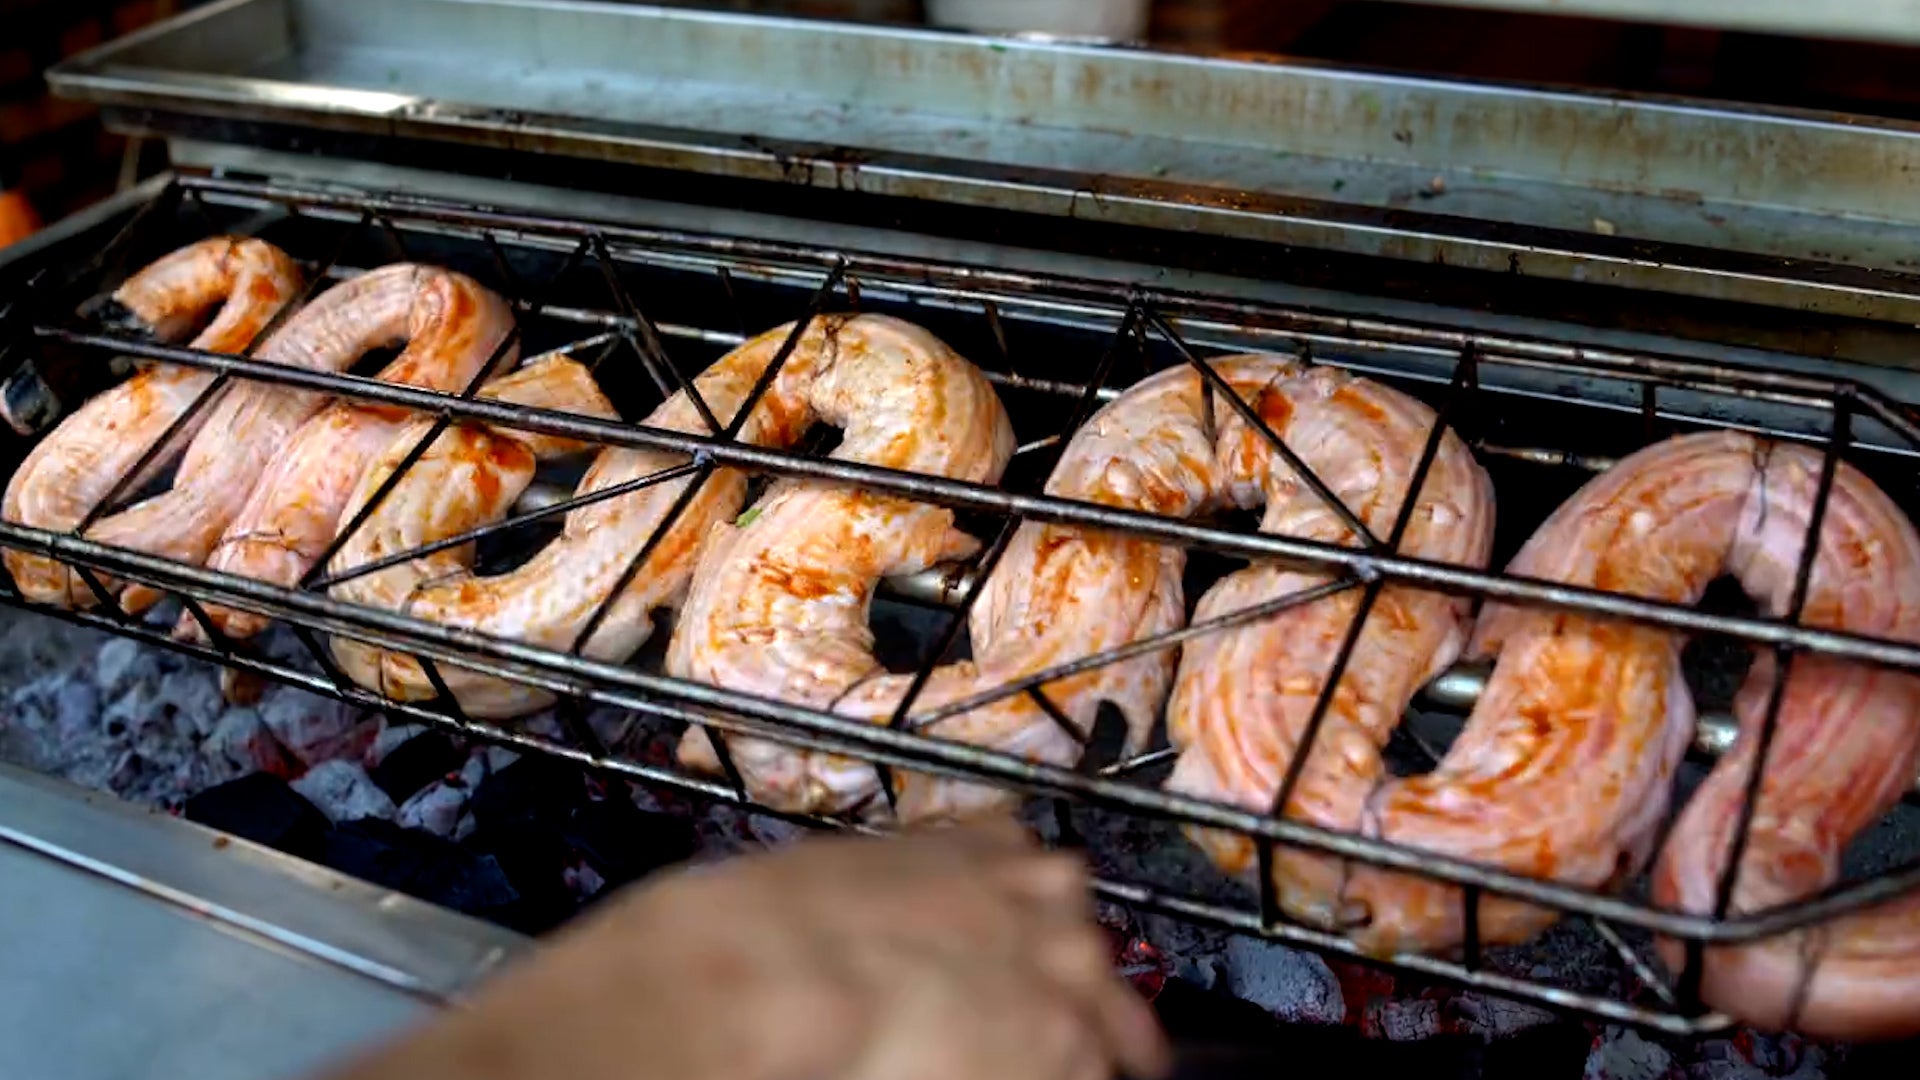
New USDA Plant Hardiness Zone Map for gardeners shows a warming climate
Wintertime minimum temperatures in the U.S. have risen so much in recent decades that the United States Department of Agriculture decided last week to update their Plant Hardiness Zone Map for gardeners for the first time since 1990. The Plant Hardiness Zone Map is the standard by which gardeners and growers can determine which plants are most likely to thrive at a location. The map is based on the average annual minimum winter temperature, divided into 10-degree F zones. Compared to the 1990 version, zone boundaries in the new 2012 edition of the map have generally shifted one 5-degree Fahrenheit half-zone warmer than the previous map throughout much of the United States. This is mostly a result of using temperature data from a longer and more recent time period. The old 1990 map was based on temperature data from only a 13-year period of 1974-1986, while the new map uses data from the 30-year period 1976-2005.

Figure 1. Comparison of the 1990 and 2012 USDA Plant Hardiness Zone Maps. Image credit: USDA and Arbor Day Foundation
Northwards, ho!
While humans are generally not attuned enough to nature's rhythms to tell if the climate is changing, plants and animals know the climate is changing. Many species of animals, insects, and plants have shifted their ranges poleward and to higher elevations in recent decades because of global warming. The 2007 IPCC report stated that "numerous studies document a progressively earlier spring by about 2.3 to 5.2 days per decade in the last 30 years in response to climate warming. That report also documented over 400 species that have moved their ranges poleward or to higher elevations because of climate change. For example, conifer trees expanded northwards into former tundra areas at a rate of 12 km per year between 1982 - 2000 in portions of Canada (Fillol and Royer, 2003.) Holly plants moved northwards by several hundred kilometers in recent decades into coastal Norway, Northeast Germany, Denmark, and coastal Sweden in response to warming temperatures (Walther et al., 2005.) As the climate continues to warm, plant and animal species previously unknown in many regions will appear, and will disappear from places they used to inhabit.

Figure 2. Change in the boundary line between conifer forest (taiga) and tundra between 1982 (grey line) and 2000 (white line) over Canada. In the grey box marked "Transect", the rate of northwards migration was 12 km per year, or 228 km (142 miles) in nineteen years. Image credit: Fillol and Royer, 2003, "Variability analysis of the transitory climate regime as defined by the NDVI/Ts relationship derived from NOAA-AVHRR over Canada", Geoscience and Remote Sensing Symposium, 2003. IGARSS '03. Proceedings. 2003 IEEE International.
Jeff Masters
Reader Comments
Page: 1 | 2 | 3 | 4 | 5 | 6 | 7 | 8 — Blog Index
You misspelled ignorance.
And from the mouths of babies......
the source of ignorance is defined (and demonstrated)
31 January 2012 - This week's cold weather has seen the Met Office issue its first England-wide Level 3 Cold Weather Alert of the winter.
The alert was issued because of the expected frosty nights and low daytime temperatures. We have already seen temperatures as low as -6.2°C in Pershore, Worcestershire, -6.1°C in South Farnborough, Hampshire and -5.7°C in Hurn, Dorset this week and the Level 3 Alert is expected to remain in force until the weekend.
The Met Office Cold Weather Alert service supports the Cold Weather Plan developed by the Department of Health, the Health Protection Agency and Age UK to help reduce the impact of cold weather on people's health in winter.
I disagree. We all vote daily, in the way We spend Our money and conduct Our daily lives. The smart money, including the money behind politicians and their campaigns, follows those votes (ignoring opinion polls and other bogosities that don't follow Our spending and behavior patterns) and adjusts accordingly. There is a reason why these folks have the money, and I think this is it. We matter. We are all that matters, politically. To argue otherwise, I think, is a cop-out - a highly unadvisable cop-out in a political system that relies on the active, and informed, participation of its citizens.
I'll have to check on the stats re: electricity generation and its contribution of carbon dioxide to the environment, vs. the contribution made by automobiles (the big donor, last I looked).
Technically it isn't the CO2/temperature record that has led to the understanding that CO2 causes temperature changes as a greenhouse gas. The correlation noted does not automatically equal causation. Sometimes people fall into this trap and then the "CO2 lags temperature" argument gets started.
The reason we know there is a causation is because there is a known physical mechanism by which the physical properties of greenhouse gases re-emit longwave energy, some of which returns to the surface of the earth. Increase the amount of energy returning to earth, increase the stored heat energy of the climate system. The mere correlation isn't the point - CO2's ability to remit longwave radiation, known for over a century, is.
Have you ever gone by the name of Ike on another forum? You're method of communicating is pleasantly familiar.
/end off topic (there is a topic?)
fun...want fun on this blog, then talk about the weather or something atleast related to it. seems anything people talk about is politics n other crap.
Said it to WxGeekVA. I dont argue anymore, i just hit ignore.
And for the 4th time...if i am a troll, so is all of wunderground.
ITT, we poof everyone who calls us out on something we're actually guilty of.
Kid, eventually you're going to have to face reality.
who the heck you callin Taz?
Your basing your entire argument off false assumptions, false attributions, and incorrect information. You should read the IPCC report, which is a collective summary of the science about climate and climate change.
Then, even if you disagree, you will be able to form much better arguments. Know thy enemy and all that.
where at?
Ok then. thank you for not blowing up like the others :D
Sex, booze, and campfire stories.
Or at least I do.
Dec - May.
May - Nov.
In order of commonness: Climate, Religion, Politics, Weather, and last but not least Chuck Norris.
This about sums it up.
Sometimes. May-Nov is Troll Season....
Your making a false assumption. It doesn't take 50 years for conifer forest to grow. Depending on the type of conifer, the growth rates vary between 1 and 2 feet per year. So you can easily get a full forest within 15 years, let alone 30.
The other assumption you are making is that google earth has recent high res imagery of everywhere on the globe. This is not the case. Underpopulated areas aren't updated nearly as frequently, with some areas being 3 to more then ten years old, imagery wise.
For example, your location for showing tundra vs. trees demonstrates this point exactly. That area only has low res imagery available, making it imposible to tell anything other than the blobby mass of pixels is green. There is no way you can discern one way or another whether it is tundra or trees, though the green may imply trees.
So your arguments don't hold up to scrutiny. Besides, there's no way the could have used Google Earth, since the paper was published in 2003. What they probably used instead were survey maps and fly overs to verify the tree line growth, which is a lot more scientifically valid.
Toenail collections and Burt Bacharach. On a loop. Endlessly.
Last season it was so wild that people threw their keyboards through the computer screen during Irene.
While CFCs don't affect CO2 content, they are indeed a greenhouse gas. Their destruction of ozone also ends up increasing warming, but it is minor in comparison to their primary effect.
Like CO2, CFCs stay in the atmosphere for a long time. If they weren't banned due to their destructive effects on the ozone, we'd also be seeing more warming as a result of them.
Link
I do as well, at least with the campfire stories.
Viewing: 151 - 201
Page: 1 | 2 | 3 | 4 | 5 | 6 | 7 | 8 — Blog Index