Skip to Main Content
_
Sensor Network
Maps & Radar
Severe Weather
News & Blogs
Mobile Apps
More
Search
close
gps_fixed
gps_fixed
Find Nearest Station
Manage Favorite Cities
Log In
Go Ad Free
account_box
Log in
Go Ad Free
settings
Settings
Sensor Network
Maps & Radar
Severe Weather
News & Blogs
Mobile Apps
Historical Weather
star
Current Weather for
Popular
Cities
San Francisco, CA
56
°
F
Cloudy
Manhattan, NY
51
°
F
Partly Cloudy
Schiller Park, IL (60176)
warning
39
°
F
Cloudy
Boston, MA
45
°
F
Cloudy
Houston, TX
71
°
F
Cloudy
St James's, England, United Kingdom
47
°
F
Mostly Cloudy
Search
close
gps_fixed
gps_fixed
Find Nearest Station
Manage Favorite Cities
settings
--
Feels like
--
--
--
/
--
--
--
--
--
--
--
--
--
--
12AM
6AM
NOON
6PM
12AM
Apr 24
+0000
Apr 25
Full Forecast
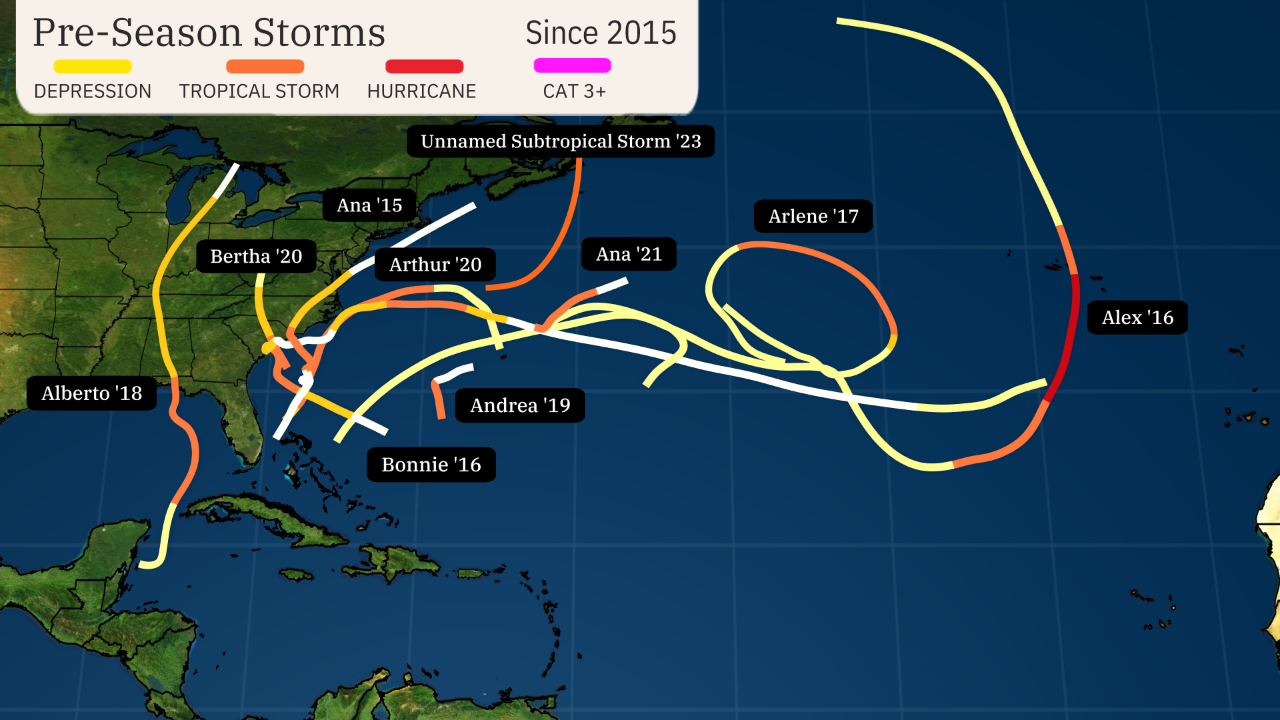
Hurricane Season Doesn't Have To Wait Until June
It sounds weird, but it could happen again in 2024. Here's why.
Hurricane Season Doesn't Have To Wait Until June
City Left Bathed In Eerie, Otherworldly Red Glow
An otherworldly red haze hung over the city of Derna, Libya, after an intense dust storm.
City Left Bathed In Eerie, Otherworldly Red Glow
States Gear Up For Severe Threat; Hail, Wind Damage, Tornadoes
A classic springtime setup will ignite bouts of severe storms in the central U.S. beginning Thursday. Here's what to know.
States Gear Up For Severe Threat; Hail, Wind Damage, Tornadoes
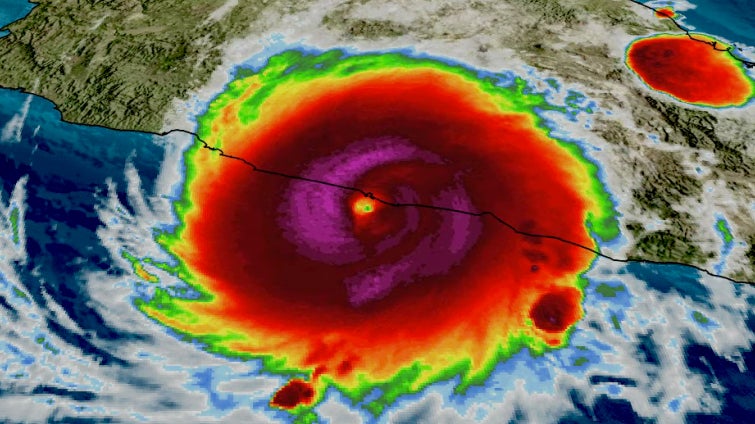
Forecasting Hurricanes Can Be A Major Headache
Hurricane forecasting can be a teeth-gnashing experience for meteorologists. Here are four of the reasons why.
Forecasting Hurricanes Can Be A Major Headache
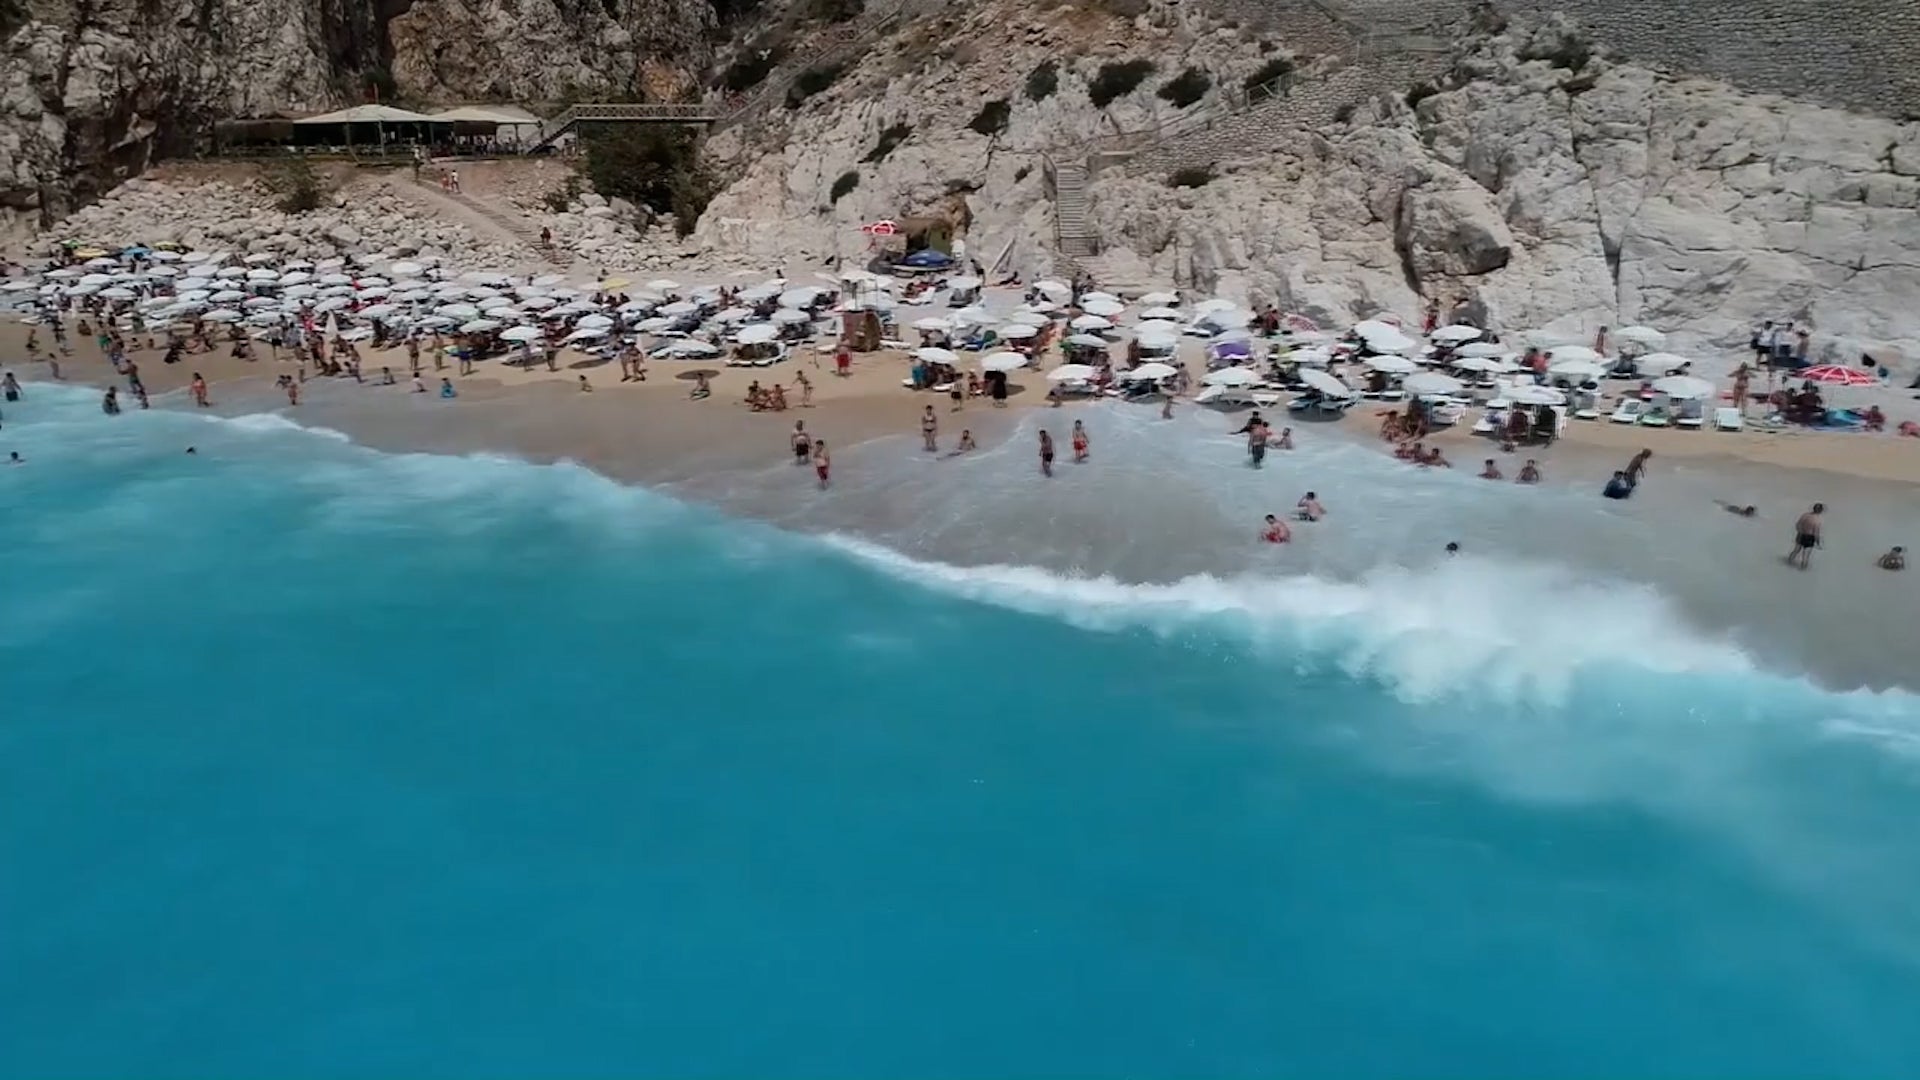
This Beach Has The Bluest Waters In The World
A travel agency collected images from Google Maps and cross-referenced them against the certified bluest shade of blue in order to find the beach with the bluest waters on Earth.
This Beach Has The Bluest Waters In The World
Please enable JavaScript to continue using this application.