Skip to Main Content
_
Sensor Network
Maps & Radar
Severe Weather
News & Blogs
Mobile Apps
More
Search
close
gps_fixed
gps_fixed
Find Nearest Station
Manage Favorite Cities
Log In
Go Ad Free
account_box
Log in
Go Ad Free
settings
Settings
Sensor Network
Maps & Radar
Severe Weather
News & Blogs
Mobile Apps
Historical Weather
star
Current Weather for
Popular
Cities
San Francisco, CA
warning
70
°
F
Sunny
Manhattan, NY
warning
79
°
F
Partly Cloudy
Schiller Park, IL (60176)
78
°
F
Fair
Boston, MA
59
°
F
Showers in the Vicinity
Houston, TX
warning
86
°
F
Cloudy
St James's, England, United Kingdom
68
°
F
Sunny
Search
close
gps_fixed
gps_fixed
Find Nearest Station
Manage Favorite Cities
settings
warning
Active Advisory
:
Small Craft Advisory
(
See More
)
--
Feels like
--
--
--
/
--
--
--
--
--
--
--
--
--
--
12AM
6AM
NOON
6PM
12AM
May 8
+0000
May 9
Full Forecast
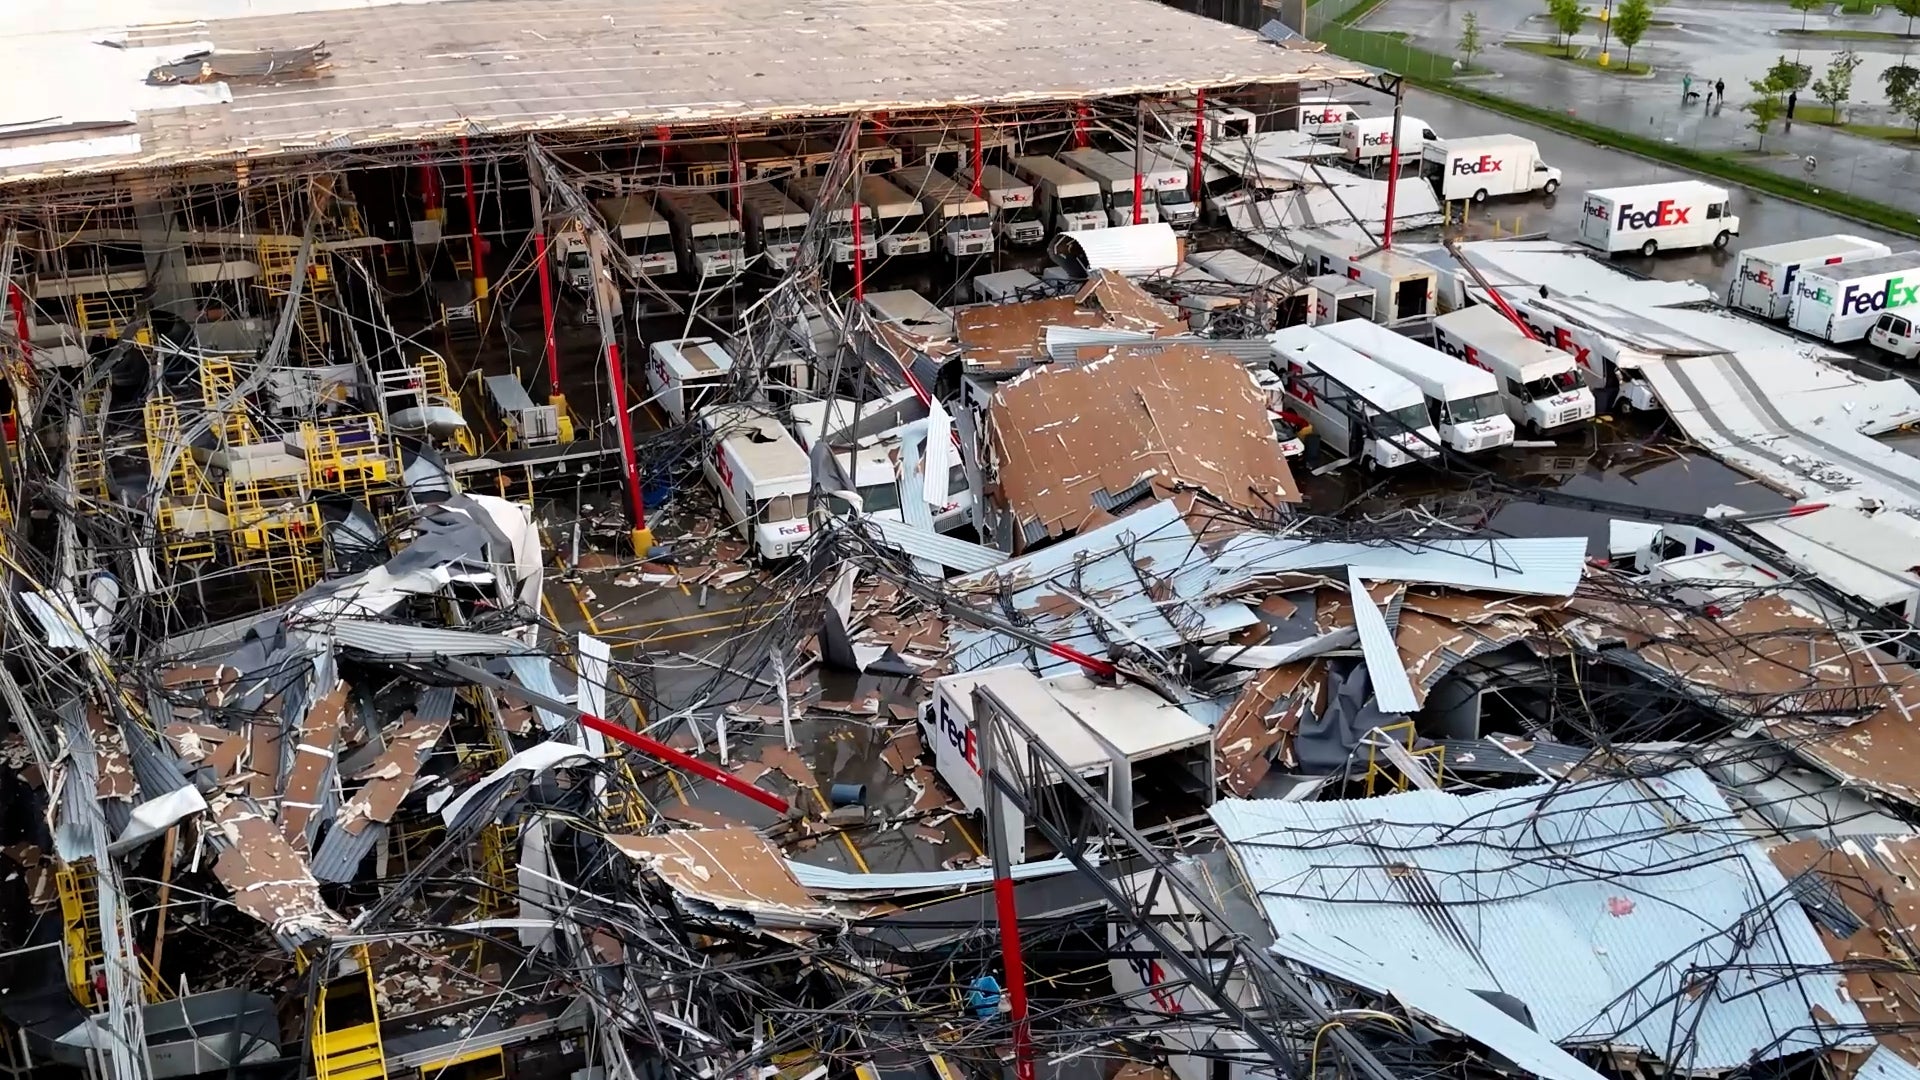
Tornadoes Pummeled Michigan; Flattening FedEx Facility
Several tornadoes hit southern Michigan on Tuesday night, striking a FedEx facility in Portage. Here's the latest.
Tornadoes Pummeled Michigan; Flattening FedEx Facility
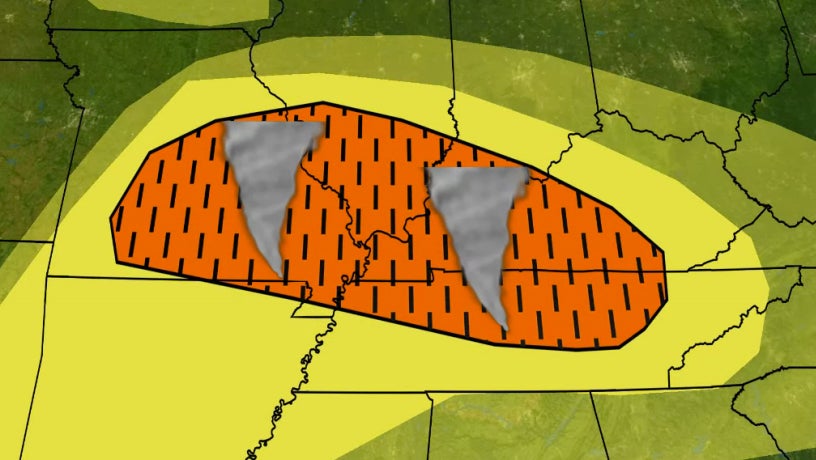
Severe Weather Outbreak Brings Dangerous Storms Here Today
Another severe thunderstorm outbreak is spreading through the Midwest, South and East. Here's a look at the forecast.
Severe Weather Outbreak Brings Dangerous Storms Here Today
Shocking Video Captures Tornado Shrapnel Impaling Hotel Wall
A tornado in Bartlesville, Oklahoma, inflicted significant damage on a Hampton Inn, turning debris into projectiles that pierced the building
Shocking Video Captures Tornado Shrapnel Impaling Hotel Wall
Today's Tornado Threat: 5 Things You Need To Know
Tornadoes are a concern in the Midwest and South through Wednesday night. Here's what to know about this threat.
Today's Tornado Threat: 5 Things You Need To Know
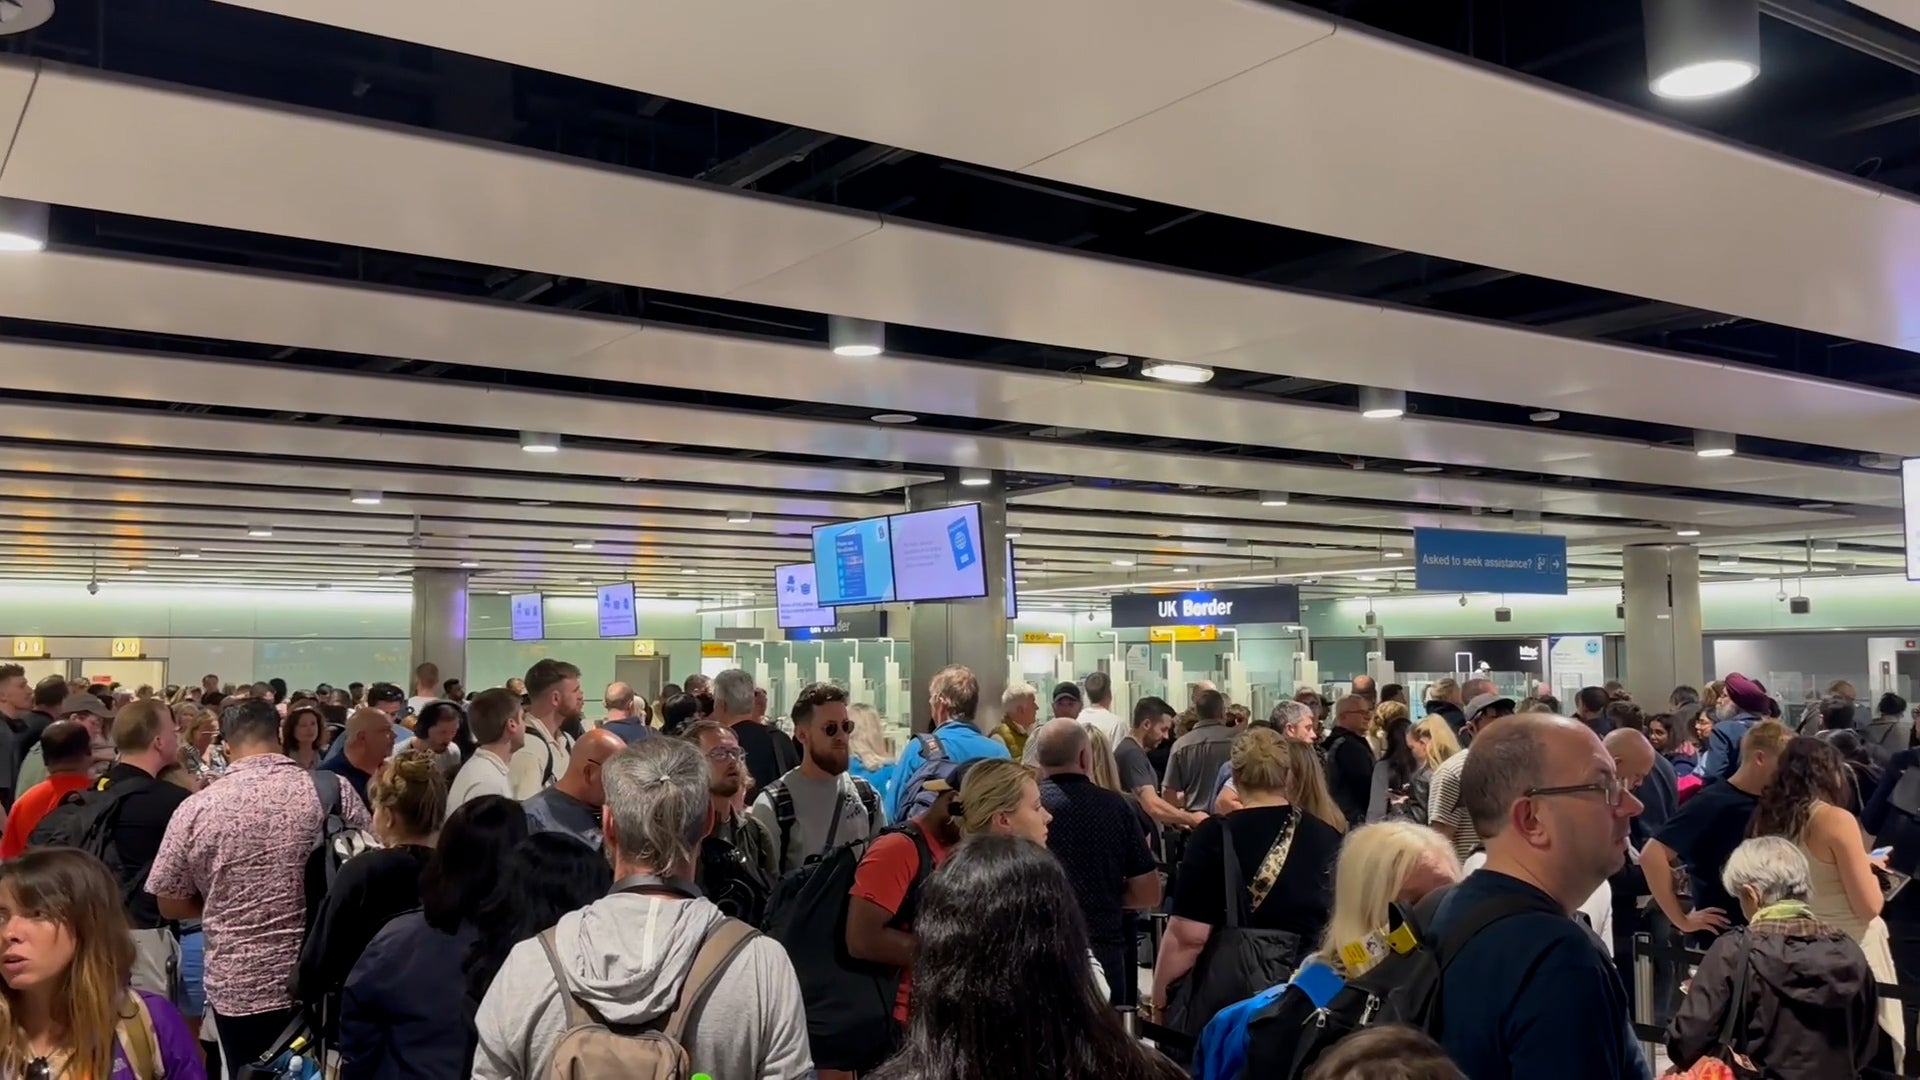
Airport Outage Leaves Thousands Of Passengers Stranded
Long lines of passengers were wrapped around terminals across the U.K. after a nationwide problem caused huge delays at some of the world’s busiest airports.
Airport Outage Leaves Thousands Of Passengers Stranded
Please enable JavaScript to continue using this application.